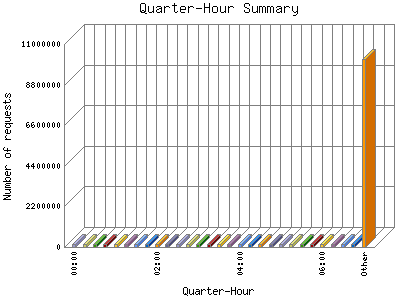
The Quarter-Hour Summary shows an overview of site activity over the course of a day, broken down into fifteen-minute intervals. If your report has enough traffic this will give you a detailed graph of your site's load throughout the day.
| Quarter-Hour | Number of requests | Percentage of the requests | |
|---|---|---|---|
| 1. | 00:00 | 519,605 | 1% |
| 2. | 00:15 | 516,694 | 0.100% |
| 3. | 00:30 | 518,299 | 1% |
| 4. | 00:45 | 536,353 | 1.3% |
| 5. | 01:00 | 546,532 | 1.6% |
| 6. | 01:15 | 531,904 | 1.2% |
| 7. | 01:30 | 524,138 | 1.1% |
| 8. | 01:45 | 525,817 | 1.1% |
| 9. | 02:00 | 533,695 | 1.3% |
| 10. | 02:15 | 521,982 | 1% |
| 11. | 02:30 | 946,833 | 1.82% |
| 12. | 02:45 | 530,615 | 1.2% |
| 13. | 03:00 | 946,033 | 1.82% |
| 14. | 03:15 | 698,247 | 1.34% |
| 15. | 03:30 | 544,206 | 1.6% |
| 16. | 03:45 | 526,899 | 1.1% |
| 17. | 04:00 | 543,953 | 1.6% |
| 18. | 04:15 | 532,737 | 1.2% |
| 19. | 04:30 | 518,485 | 1% |
| 20. | 04:45 | 731,912 | 1.41% |
| 21. | 05:00 | 577,152 | 1.11% |
| 22. | 05:15 | 535,283 | 1.3% |
| 23. | 05:30 | 525,891 | 1.1% |
| 24. | 05:45 | 529,585 | 1.2% |
| 25. | 06:00 | 524,877 | 1.1% |
| 26. | 06:15 | 539,145 | 1.4% |
| 27. | 06:30 | 516,692 | 0.100% |
| 28. | 06:45 | 517,317 | 0.100% |
| 29. | 07:00 | 520,438 | 1% |
| 30. | 07:15 | 524,547 | 1.1% |
| 31. | 07:30 | 517,201 | 0.100% |
| 32. | 07:45 | 519,176 | 1% |
| 33. | 08:00 | 535,565 | 1.3% |
| 34. | 08:15 | 598,027 | 1.16% |
| 35. | 08:30 | 527,119 | 1.1% |
| 36. | 08:45 | 519,921 | 1% |
| 37. | 09:00 | 524,456 | 1.1% |
| 38. | 09:15 | 508,030 | 0.99% |
| 39. | 09:30 | 513,009 | 0.100% |
| 40. | 09:45 | 516,854 | 0.100% |
| 41. | 10:00 | 520,724 | 1% |
| 42. | 10:15 | 525,382 | 1.1% |
| 43. | 10:30 | 505,467 | 0.98% |
| 44. | 10:45 | 520,459 | 1% |
| 45. | 11:00 | 508,991 | 0.99% |
| 46. | 11:15 | 515,754 | 0.100% |
| 47. | 11:30 | 511,714 | 0.99% |
| 48. | 11:45 | 517,185 | 0.100% |
| 49. | 12:00 | 504,529 | 0.98% |
| 50. | 12:15 | 516,319 | 0.100% |
| 51. | 12:30 | 507,244 | 0.98% |
| 52. | 12:45 | 508,055 | 0.99% |
| 53. | 13:00 | 505,349 | 0.98% |
| 54. | 13:15 | 506,113 | 0.98% |
| 55. | 13:30 | 505,541 | 0.98% |
| 56. | 13:45 | 498,504 | 0.97% |
| 57. | 14:00 | 513,281 | 0.100% |
| 58. | 14:15 | 515,218 | 0.100% |
| 59. | 14:30 | 503,607 | 0.98% |
| 60. | 14:45 | 503,752 | 0.98% |
| 61. | 15:00 | 501,668 | 0.97% |
| 62. | 15:15 | 902,946 | 1.74% |
| 63. | 15:30 | 595,441 | 1.14% |
| 64. | 15:45 | 505,023 | 0.98% |
| 65. | 16:00 | 551,935 | 1.7% |
| 66. | 16:15 | 516,013 | 0.100% |
| 67. | 16:30 | 521,614 | 1% |
| 68. | 16:45 | 558,381 | 1.8% |
| 69. | 17:00 | 518,876 | 1% |
| 70. | 17:15 | 508,923 | 0.99% |
| 71. | 17:30 | 511,875 | 0.99% |
| 72. | 17:45 | 517,846 | 1% |
| 73. | 18:00 | 557,136 | 1.8% |
| 74. | 18:15 | 508,442 | 0.99% |
| 75. | 18:30 | 508,133 | 0.99% |
| 76. | 18:45 | 510,781 | 0.99% |
| 77. | 19:00 | 513,936 | 0.100% |
| 78. | 19:15 | 539,363 | 1.4% |
| 79. | 19:30 | 508,754 | 0.99% |
| 80. | 19:45 | 510,382 | 0.99% |
| 81. | 20:00 | 515,975 | 0.100% |
| 82. | 20:15 | 508,545 | 0.99% |
| 83. | 20:30 | 510,740 | 0.99% |
| 84. | 20:45 | 531,160 | 1.2% |
| 85. | 21:00 | 509,112 | 0.99% |
| 86. | 21:15 | 530,762 | 1.2% |
| 87. | 21:30 | 526,212 | 1.1% |
| 88. | 21:45 | 518,635 | 1% |
| 89. | 22:00 | 529,656 | 1.2% |
| 90. | 22:15 | 520,423 | 1% |
| 91. | 22:30 | 519,423 | 1% |
| 92. | 22:45 | 521,666 | 1% |
| 93. | 23:00 | 525,820 | 1.1% |
| 94. | 23:15 | 530,827 | 1.2% |
| 95. | 23:30 | 518,595 | 1% |
| 96. | 23:45 | 521,421 | 1% |
This report was generated on August 3, 2026 01:26.
Report time frame January 11, 2024 06:00 to August 2, 2026 04:59.
| Web statistics report produced by: | |
 Analog 5.24 Analog 5.24 |  Report Magic for Analog 2.13 Report Magic for Analog 2.13 |